Loading...
Accountability6 min read
Tax Freedom Day Is June 9, 2026. The Average Canadian Family Will Hand $72,539 to Government This Year — 43.5% of Its Income. Here's the Full Breakdown.
Tax Freedom Day is the day the average Canadian family finally finishes paying its annual tax bill and starts working for itself. In 2026, that day is June 9 — one day later than 2025, and almost two months later than 1961. The Fraser Institute's breakdown of the $72,539 bill: $25,352 in income tax, $17,069 in payroll and health taxes, $10,519 in sales tax, $7,819 in corporate tax passed through in prices, $4,939 in property tax, plus fuel, carbon, liquor, tobacco, amusement, import, and natural-resource levies. The chart shows every line.
How we reported this
All ten line items in the breakdown table are taken directly from Table 2 (Canada column) of the Fraser Institute's "Canadians Celebrate Tax Freedom Day on June 9, 2026" report (Palacios, Fuss, and Li, 2026). The numbers are preliminary estimates based on private-sector forecasts of personal income, federal and provincial budget tax revenue projections, and the Fraser Institute's Canadian Tax Simulator 2026, which draws on the Statistics Canada Social Policy Simulation Database and Model (SPSD/M) version 34.0 (based on the 2022 Canadian Income Survey). The total verifies to $72,539 exactly. Year-over-year changes ($1,057 income tax, $569 payroll & health, $446 sales, $189 property, $283 other; declines in profit, amusement, import duties, and natural-resource levies) are from the report's commentary on Table 4. The provincial Tax Freedom Day list is from Table 1 of the same report. The 1961 baseline ($1,675 tax on $5,000 income, 33.5%) is from the Fraser Canadian Consumer Tax Index 2025 edition (Fuss and Munro, 2025), Table 2. The Fraser methodology counts business taxes (corporate income tax, employer-side payroll, etc.) as ultimately borne by households — the standard tax-incidence assumption in economics — which is why the household-level total ($72,539) is higher than what appears on a personal tax return. The article notes this in the "yes but" section. We did not contact the Fraser Institute, the Department of Finance, the Canada Revenue Agency, or any provincial government for this article; the data is public and cited at the foot.
Tax Freedom Day is the Fraser Institute's annual calculation of the day the average Canadian family has earned enough money to pay the taxes it owes to federal, provincial, and local governments combined. In 2026, that day is June 9. By the Fraser methodology, the average Canadian family (two or more individuals) will earn $166,790 in cash income this year and pay $72,539 in total taxes — 43.5% of its income. Tax Freedom Day arrives one day later than 2025 (June 8) because total taxes are growing faster (+3.0%, +$2,098) than cash income (+2.2%, +$3,575). The single largest year-over-year increase was income taxes (+$1,057 per family), followed by payroll & health taxes (+$569), sales taxes (+$446), property taxes (+$189), and "other taxes" (+$283). Profit taxes, import duties, alcohol/tobacco/amusement taxes, and natural-resource levies all declined slightly. Two provinces raised personal income tax rates for 2026: British Columbia raised its lowest bracket from 5.06% to 5.60%, and Prince Edward Island introduced a new top bracket for income over $200,000 at 20.0%. The earliest provincial Tax Freedom Day falls on May 20 in Saskatchewan; the latest is June 27 in Quebec, with Ontario at June 8. The full category-by-category breakdown of the $72,539 tax bill — every line from the Fraser Table 2 Canada column, summing exactly to $72,539 — is in the chart attached to this article.
What Tax Freedom Day actually measures
Tax Freedom Day is a single calculation, run every year by the Fraser Institute, that asks one question: **if the average Canadian family had to pay its entire annual tax bill before keeping a single dollar of its earnings, on what day of the year would it finish?**
In 2026, that day is **June 9**. The day before is the last day every dollar earned goes to government. June 9 is the first day the family starts keeping what it makes.
The methodology counts every level of government and every type of tax. That means:
- Federal income tax + every provincial income tax - CPP and EI premiums (both the employee side and the employer side, because the employer side is part of compensation the employee would otherwise receive) - Provincial health premiums and payroll taxes - GST + every provincial sales tax (HST in Atlantic Canada and Ontario; PST in BC, Saskatchewan, Manitoba; QST in Quebec) - Municipal property tax (paid directly by homeowners, baked into rent for renters) - Federal and provincial fuel excise + the carbon tax + motor vehicle licence fees - Liquor markups + tobacco excise + amusement/entertainment levies - Corporate income tax (counted at the household level because businesses pass it through in prices) - Import duties - Natural resource royalties and fees - Other miscellaneous excise and levies
Added together, the Fraser methodology calculates the average Canadian family (two or more individuals) will pay **$72,539** in total taxes in 2026 on **$166,790** in cash income — **43.5 percent**. That works out to 159 days of the year, ending June 8. June 9 is liberation day.
The full breakdown — every dollar, every category
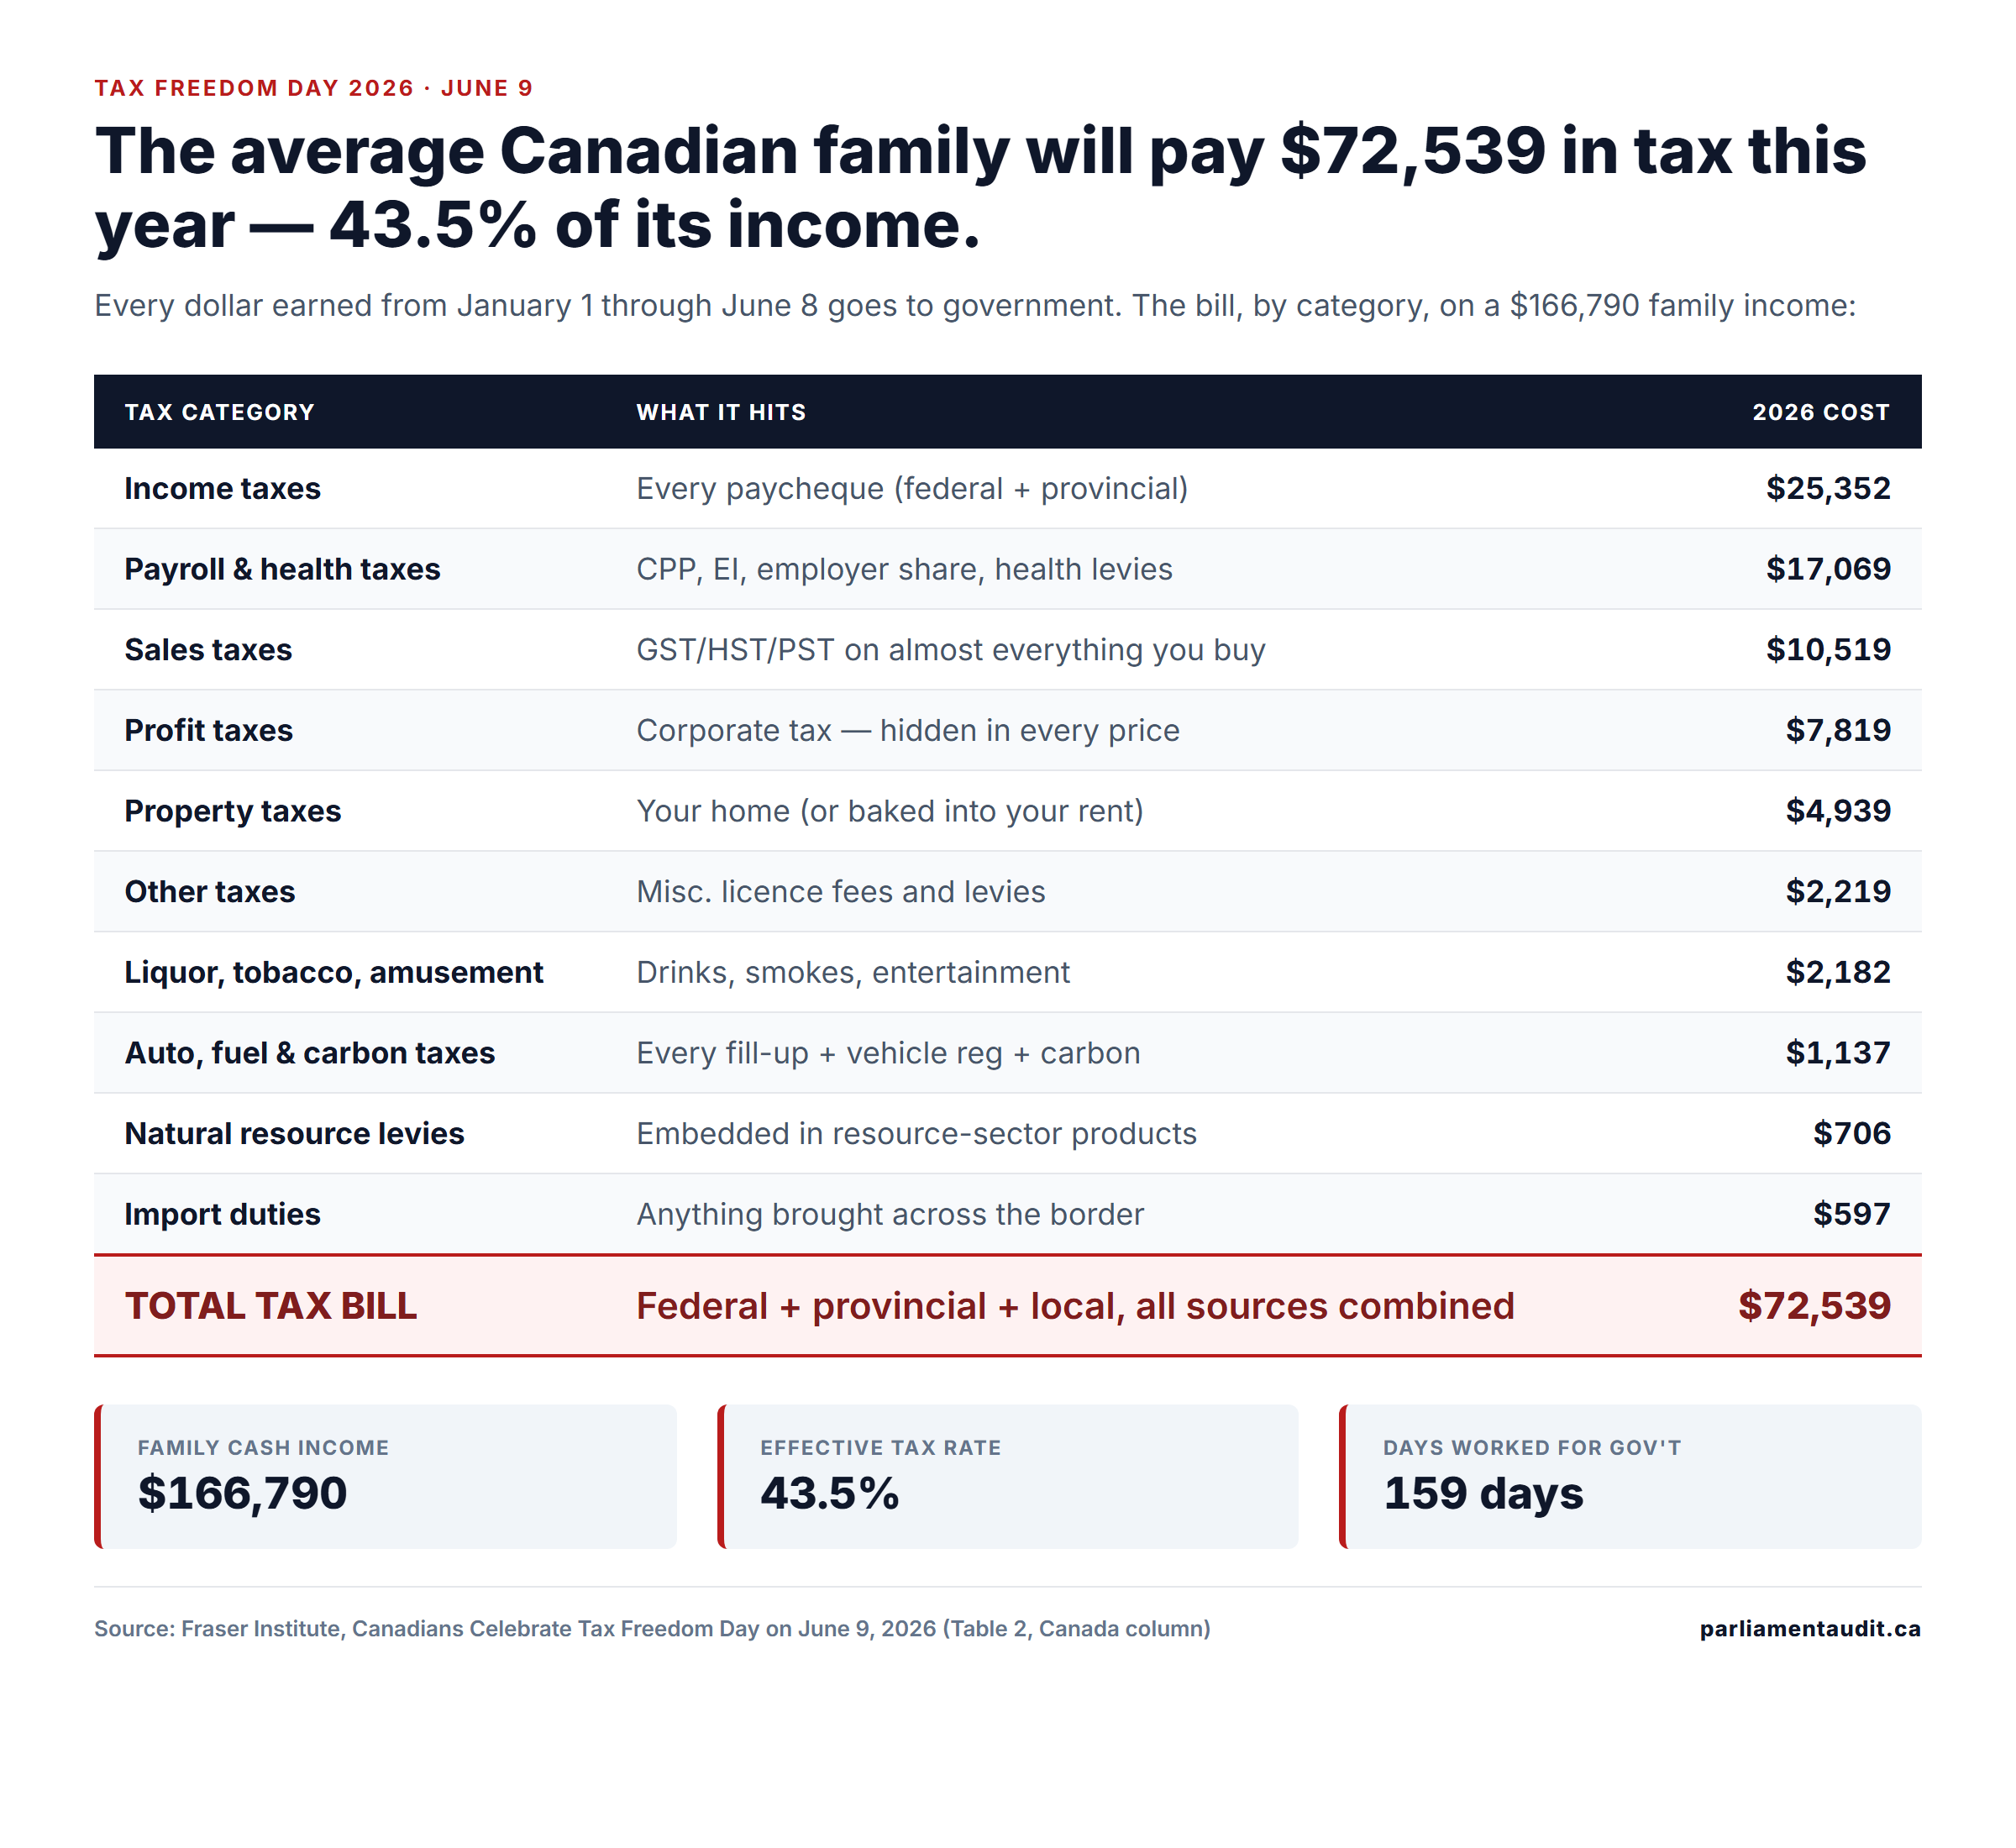
The chart attached to this article shows the full Fraser Institute Table 2 for Canada in 2026. Every line is the official preliminary estimate. The ten line items sum to exactly $72,539. Reading them in order of size:
- **Income taxes: $25,352** — federal and provincial combined. The biggest single line. - **Payroll & health taxes: $17,069** — CPP and EI (employee side AND employer side, which is the part most Canadians don't see on their pay stub), provincial health levies, payroll levies for things like Quebec's QPIP. Together these are the second-biggest line, and almost two-thirds the size of income tax. - **Sales taxes: $10,519** — GST, HST, PST, QST combined. This is the tax you pay on almost every transaction. Groceries are mostly exempt; restaurants, prepared foods, snacks, alcohol, entertainment, clothing, electronics, services — all in. - **Profit taxes: $7,819** — corporate income tax that businesses pay directly, but which is passed through to consumers in higher prices. The Fraser methodology counts this as a household-borne tax. This is the standard "tax incidence" assumption in economics (with caveats — see "yes but" below). - **Property taxes: $4,939** — paid directly if you own, baked into rent if you don't. - **Other taxes: $2,219** — miscellaneous licence fees and minor levies. - **Liquor, tobacco, amusement, & other excise: $2,182** — the "sin tax" line. Provincial alcohol markups, federal and provincial tobacco excise, amusement-tax levies on entertainment. - **Auto, fuel, motor vehicle licence & carbon taxes: $1,137** — federal excise on gasoline (10¢/L), provincial fuel taxes (variable by province), the carbon tax, plus motor vehicle registration. (Important footnote: the GST/HST you pay on fuel is in the sales-tax line above, not here. This line is the direct excise only.) - **Natural resource levies: $706** — embedded in resource-sector products. - **Import duties: $597** — anything brought across the border carries an import-duty component.
For the "things like gas, groceries, and entertainment" framing: gas is $1,137 in direct excise plus a share of the $10,519 sales-tax line (the GST/HST levied on top of the per-litre price). Most basic groceries are GST/HST-exempt, but the prepared, snack, restaurant, and beverage portion of the food budget sits in the sales-tax line. Entertainment — concerts, streaming subscriptions, restaurant meals, movies — sits in the sales-tax line plus a portion of the amusement excise.
Tax Freedom Day is moving later, not earlier
Between 2025 and 2026, the average family's total tax bill **rose 3.0 percent** ($2,098). Cash income rose only **2.2 percent** ($3,575). When taxes grow faster than income, Tax Freedom Day arrives later. June 9 is one day later than 2025.
The largest year-over-year increase, by category:
- Income taxes: **+$1,057** - Payroll & health taxes: +$569 - Sales taxes: +$446 - Property taxes: +$189 - Other taxes: +$283
Four categories actually declined: profit taxes (corporate tax revenue projected to fall), import duties, alcohol/tobacco/amusement taxes, and natural resource levies. But the income-tax increase alone is bigger than all four declines combined.
Two provinces explicitly raised personal income tax rates for 2026:
- **British Columbia** raised its lowest personal income tax bracket from **5.06% to 5.60%**. - **Prince Edward Island** introduced a **new top bracket** at **20.0% on income over $200,000**.
No province cut a major personal income tax rate this year.
The provincial gap is five weeks wide
Tax Freedom Day is a national average. The provincial reality is much more variable. From the Fraser Table 1, the 2026 Tax Freedom Day in each province:
- **Saskatchewan: May 20** (earliest) - Alberta: May 25 - Manitoba: May 28 - British Columbia: June 4 - Prince Edward Island: June 5 - New Brunswick: June 6 - **Ontario: June 8** - Nova Scotia: June 9 - Newfoundland & Labrador: June 19 - **Quebec: June 27** (latest)
The gap between Saskatchewan and Quebec is **38 days** — over five weeks. A family living in Quebec works five more weeks of the year for government than a family in Saskatchewan does.
Why? Higher provincial income tax rates and steeper progressive brackets in Quebec (top combined federal-provincial marginal rate above 53%), plus a higher provincial sales tax (QST at 9.975% versus PST at 6-7%), plus higher payroll levies (QPIP, the Health Services Fund, etc.). The Quebec provincial government delivers a broader basket of social programs (subsidized $9/day daycare, lower post-secondary tuition for Quebec residents, broader pharmacare) — but the tax bill side of the ledger is what Tax Freedom Day measures.
The historical arc — 1961 to 2026
Tax Freedom Day is not a new measure. The Fraser Institute has calculated it every year since 1961.
The trajectory:
- **1961: May 3.** Average family income $5,000; tax bill $1,675; **33.5%** of income. - **1981: May 30.** Tax bill had reached $11,429. - **2000: June 28.** The latest Tax Freedom Day in Canadian history — every dollar earned through almost the end of June went to government. Tax bill: $25,268. - **2010: June 10.** Two decades of federal GST cuts (7% → 6% → 5%), corporate income tax cuts, and BC, Manitoba, and Saskatchewan personal-tax relief had pulled the date back almost three weeks from the 2000 peak. - **2024: June 12.** - **2025: June 8.** - **2026: June 9.**
The total tax bill of the average Canadian family has grown **2,784 percent** since 1961 — faster than the consumer price index (+925%), faster than housing costs (+2,129%), faster than food (+927%), faster than clothing (+460%). The average family's share of income going to tax has shifted from one-third in 1961 to nearly half (43.5%) in 2026.
Incomes grew too — by about 2,186% over the period — so the inflation-adjusted real tax bill is up roughly 181%, not 2,784%. But the share of income captured by tax has unambiguously risen across that 65-year window.
The honest "yes but"
Three legitimate qualifications belong with this analysis.
**Tax Freedom Day measures price, not value.** The $72,539 funds healthcare, public schools, OAS and CPP retirement income, the Canada Child Benefit, the military, the RCMP and provincial police, the courts, roads and bridges, EI when you lose your job, and the social safety net. Whether the value received is worth the price is a question each Canadian gets to answer based on their own use of those services. Tax Freedom Day, by its authors' own description, is "not intended to measure the benefits Canadians receive from governments in return for their taxes." It is a sticker price, not a value judgment.
**The Fraser methodology counts business taxes as borne by households.** Corporate income tax, employer-side CPP and EI, and other taxes levied directly on businesses are assumed to be passed through to households in the form of higher consumer prices and lower wages. This is the standard "tax incidence" assumption in economics — it has solid empirical backing — but it is the reason the Fraser household tax bill ($72,539) is higher than what would appear on any individual tax return summed across a family. A different methodology that counted only direct household taxes would produce a smaller number. Both methodologies are defensible; Fraser's is the standard for this style of analysis.
**The 43.5% number is an average, not a universal.** Income tax is progressive — a family at $80,000 pays a much smaller share than a family at $250,000. Sales tax is somewhat regressive — it hits low-income households harder as a share of their income because they spend a higher share of income on taxable goods. Property tax depends entirely on where you live and what you own. The "average family" is a statistical construct; no individual family is precisely the average. Personal Tax Freedom Day varies sharply by income, province, household composition, and life stage.
None of those qualifiers changes the headline number. The average Canadian family is calculated to pay 43.5% of its income in tax in 2026. June 9 is the day the average family is calculated to finish paying it.
The bottom line
On the published Fraser Institute calculation, in 2026:
- The average Canadian family will earn **$166,790**. - It will pay **$72,539** in total taxes — federal + provincial + local + business taxes passed through. - That is **43.5%** of its income. - It works the first **159 days of the year** for government. - **June 9** is the first day it starts keeping what it earns.
The gap between provinces is over five weeks. The trend over 65 years is from one-third of income going to tax (1961) to nearly half (2026). The single largest line is income tax ($25,352), followed by payroll & health ($17,069), sales tax ($10,519), and corporate tax embedded in prices ($7,819).
Whether 43.5% is the right price for the basket of government services Canadians receive is a question worth asking — and it belongs in front of voters and Parliament, not in front of an accounting firm. Parliament Audit publishes the breakdown. The judgment is yours.
Sources & Official Documents
- Fraser Institute — Canadians Celebrate Tax Freedom Day on June 9, 2026 (Palacios, Fuss, Li, 2026)
- Fraser Institute — Tax Freedom Day 2026 report PDF
- Fraser Institute — Taxes versus the Necessities of Life: Canadian Consumer Tax Index 2025 (Fuss, Munro, 2025)
- Fraser Institute — Canadian Consumer Tax Index 2025 PDF
- CNW — Tax Freedom Day is tomorrow June 9
- Wealth Professional — One more day of working for the government
- Fraser Institute — Personal Tax Freedom Day Calculator
- Statistics Canada — Social Policy Simulation Database and Model (SPSD/M)
Frequently asked questions
- What is Tax Freedom Day in Canada?
- Tax Freedom Day is the Fraser Institute's annual calculation of the day the average Canadian family has earned enough money to pay all the taxes it owes to federal, provincial, and local governments for the year. In 2026, it falls on June 9 — meaning the average family works the first 159 days of the year for government before keeping anything for itself.
- How much tax does the average Canadian family pay in 2026?
- By the Fraser Institute calculation, the average Canadian family (two or more people) will pay $72,539 in total taxes in 2026 on $166,790 of cash income — 43.5% of its income. That includes income tax ($25,352), payroll and health taxes ($17,069), sales taxes ($10,519), corporate taxes passed through in prices ($7,819), property taxes ($4,939), and smaller categories like fuel, carbon, liquor, tobacco, and import duties.
- Which province has the earliest and latest Tax Freedom Day?
- In 2026, Saskatchewan has the earliest Tax Freedom Day (May 20) and Quebec the latest (June 27) — a 38-day gap. Ontario falls on June 8. The differences reflect each province's income tax rates, sales taxes, and payroll levies.
- Is Tax Freedom Day a fair measure of taxation?
- It measures the price of government, not the value received — the same money funds healthcare, education, pensions, and public services. The Fraser methodology also counts business taxes as ultimately falling on households, which is a standard economic assumption but produces a larger number than what appears on any personal tax return. The 43.5% figure is an average; actual burdens vary by income, province, and household.
More reporting on this
- AccountabilityOntario's PCs Just Defeated a Bill to Remove HST From Groceries. Here's the Math on Why Sales Tax Hits the Middle Class Hardest.
On May 27, 2026, the Doug Ford government voted down Bill 113 — the NDP's Fair Prices and Tax-Free Groceries Act, which would have removed the 13% HST from all food and drink in Ontario. The defeat is the news hook. The structural question underneath it is older: every dollar of federal and provincial sales tax falls disproportionately on lower-income and middle-class households, and the federal GST/HST credit — the mechanism designed to offset this — phases out before most middle-class earners can claim it. This is the math.
- AccountabilityAs of June 12, Your Carrier Can't Charge You to Switch Plans. It's a Real Win — and It Quietly Admits How Locked-In Canadians Were in the First Place.
A new CRTC rule that took effect June 12, 2026 bans activation, plan-change, and most cancellation fees on cell phone and internet plans — charges that ran $30 to $80 and are estimated to have cost Canadians more than $600 million a year. The fees were friction by design: switching costs that kept customers stuck. Banning them is genuinely good for your wallet. But it treats the symptom — lock-in — without touching the disease: the concentrated market that made the fees profitable and keeps Canadian prices among the developed world's highest.
- AccountabilityCanada Pumps 6.1 Million Barrels a Day and Can Refine 1.9 Million. B.C. Sends Crude to Washington State — and Buys It Back as Gasoline. During a Trade War.
Canada is the world's fourth-largest oil producer and hasn't built a major new refinery since 1984. We export 98% of our crude to one customer — the United States, which now tariffs it at 10% — much of it at a structural discount, and then re-import refined gasoline, diesel, and jet fuel. The British Columbia loop is the starkest version: Alberta crude flows down the Trans Mountain pipeline to Washington State refineries, and tankers carry the gasoline back to Vancouver. Here is the documented anatomy of the refining gap — including the honest economics of why it exists.
About this article
Parliament Audit is non-partisan and does not endorse or oppose any legislation. This article is based on publicly available legislative documents and parliamentary records; all sources are linked above.
AI-assisted, human-edited. AI tools help us ingest parliamentary records and draft analysis; an editor reviews every article and verifies key facts against primary sources before publication. Quotation marks are reserved for verbatim text from a primary source. See our methodology and corrections log.
Tell your MP what you think
Your MP votes on this. Their constituency inbox is the most-read channel for feedback on bills in committee.
Republish this story
You're welcome to run this article in full on your newsroom, blog, newsletter, or paper. Keep the byline and the link back to parliamentaudit.ca. See the full terms.
<!-- Parliament Audit — republished under CC BY-ND 4.0 -->
<article>
<h1>Tax Freedom Day Is June 9, 2026. The Average Canadian Family Will Hand $72,539 to Government This Year — 43.5% of Its Income. Here's the Full Breakdown.</h1>
<p><em>By Parliament Audit · June 9, 2026 · 6 min read</em></p>
<p><strong>Tax Freedom Day is the Fraser Institute's annual calculation of the day the average Canadian family has earned enough money to pay the taxes it owes to federal, provincial, and local governments combined. In 2026, that day is June 9. By the Fraser methodology, the average Canadian family (two or more individuals) will earn $166,790 in cash income this year and pay $72,539 in total taxes — 43.5% of its income. Tax Freedom Day arrives one day later than 2025 (June 8) because total taxes are growing faster (+3.0%, +$2,098) than cash income (+2.2%, +$3,575). The single largest year-over-year increase was income taxes (+$1,057 per family), followed by payroll & health taxes (+$569), sales taxes (+$446), property taxes (+$189), and "other taxes" (+$283). Profit taxes, import duties, alcohol/tobacco/amusement taxes, and natural-resource levies all declined slightly. Two provinces raised personal income tax rates for 2026: British Columbia raised its lowest bracket from 5.06% to 5.60%, and Prince Edward Island introduced a new top bracket for income over $200,000 at 20.0%. The earliest provincial Tax Freedom Day falls on May 20 in Saskatchewan; the latest is June 27 in Quebec, with Ontario at June 8. The full category-by-category breakdown of the $72,539 tax bill — every line from the Fraser Table 2 Canada column, summing exactly to $72,539 — is in the chart attached to this article.</strong></p>
<h2>What Tax Freedom Day actually measures</h2>
<p>Tax Freedom Day is a single calculation, run every year by the Fraser Institute, that asks one question: **if the average Canadian family had to pay its entire annual tax bill before keeping a single dollar of its earnings, on what day of the year would it finish?**</p>
<p>In 2026, that day is **June 9**. The day before is the last day every dollar earned goes to government. June 9 is the first day the family starts keeping what it makes.</p>
<p>The methodology counts every level of government and every type of tax. That means:</p>
<p>- Federal income tax + every provincial income tax
- CPP and EI premiums (both the employee side and the employer side, because the employer side is part of compensation the employee would otherwise receive)
- Provincial health premiums and payroll taxes
- GST + every provincial sales tax (HST in Atlantic Canada and Ontario; PST in BC, Saskatchewan, Manitoba; QST in Quebec)
- Municipal property tax (paid directly by homeowners, baked into rent for renters)
- Federal and provincial fuel excise + the carbon tax + motor vehicle licence fees
- Liquor markups + tobacco excise + amusement/entertainment levies
- Corporate income tax (counted at the household level because businesses pass it through in prices)
- Import duties
- Natural resource royalties and fees
- Other miscellaneous excise and levies</p>
<p>Added together, the Fraser methodology calculates the average Canadian family (two or more individuals) will pay **$72,539** in total taxes in 2026 on **$166,790** in cash income — **43.5 percent**. That works out to 159 days of the year, ending June 8. June 9 is liberation day.</p>
<h2>The full breakdown — every dollar, every category</h2>
<p>The chart attached to this article shows the full Fraser Institute Table 2 for Canada in 2026. Every line is the official preliminary estimate. The ten line items sum to exactly $72,539. Reading them in order of size:</p>
<p>- **Income taxes: $25,352** — federal and provincial combined. The biggest single line.
- **Payroll & health taxes: $17,069** — CPP and EI (employee side AND employer side, which is the part most Canadians don't see on their pay stub), provincial health levies, payroll levies for things like Quebec's QPIP. Together these are the second-biggest line, and almost two-thirds the size of income tax.
- **Sales taxes: $10,519** — GST, HST, PST, QST combined. This is the tax you pay on almost every transaction. Groceries are mostly exempt; restaurants, prepared foods, snacks, alcohol, entertainment, clothing, electronics, services — all in.
- **Profit taxes: $7,819** — corporate income tax that businesses pay directly, but which is passed through to consumers in higher prices. The Fraser methodology counts this as a household-borne tax. This is the standard "tax incidence" assumption in economics (with caveats — see "yes but" below).
- **Property taxes: $4,939** — paid directly if you own, baked into rent if you don't.
- **Other taxes: $2,219** — miscellaneous licence fees and minor levies.
- **Liquor, tobacco, amusement, & other excise: $2,182** — the "sin tax" line. Provincial alcohol markups, federal and provincial tobacco excise, amusement-tax levies on entertainment.
- **Auto, fuel, motor vehicle licence & carbon taxes: $1,137** — federal excise on gasoline (10¢/L), provincial fuel taxes (variable by province), the carbon tax, plus motor vehicle registration. (Important footnote: the GST/HST you pay on fuel is in the sales-tax line above, not here. This line is the direct excise only.)
- **Natural resource levies: $706** — embedded in resource-sector products.
- **Import duties: $597** — anything brought across the border carries an import-duty component.</p>
<p>For the "things like gas, groceries, and entertainment" framing: gas is $1,137 in direct excise plus a share of the $10,519 sales-tax line (the GST/HST levied on top of the per-litre price). Most basic groceries are GST/HST-exempt, but the prepared, snack, restaurant, and beverage portion of the food budget sits in the sales-tax line. Entertainment — concerts, streaming subscriptions, restaurant meals, movies — sits in the sales-tax line plus a portion of the amusement excise.</p>
<h2>Tax Freedom Day is moving later, not earlier</h2>
<p>Between 2025 and 2026, the average family's total tax bill **rose 3.0 percent** ($2,098). Cash income rose only **2.2 percent** ($3,575). When taxes grow faster than income, Tax Freedom Day arrives later. June 9 is one day later than 2025.</p>
<p>The largest year-over-year increase, by category:</p>
<p>- Income taxes: **+$1,057**
- Payroll & health taxes: +$569
- Sales taxes: +$446
- Property taxes: +$189
- Other taxes: +$283</p>
<p>Four categories actually declined: profit taxes (corporate tax revenue projected to fall), import duties, alcohol/tobacco/amusement taxes, and natural resource levies. But the income-tax increase alone is bigger than all four declines combined.</p>
<p>Two provinces explicitly raised personal income tax rates for 2026:</p>
<p>- **British Columbia** raised its lowest personal income tax bracket from **5.06% to 5.60%**.
- **Prince Edward Island** introduced a **new top bracket** at **20.0% on income over $200,000**.</p>
<p>No province cut a major personal income tax rate this year.</p>
<h2>The provincial gap is five weeks wide</h2>
<p>Tax Freedom Day is a national average. The provincial reality is much more variable. From the Fraser Table 1, the 2026 Tax Freedom Day in each province:</p>
<p>- **Saskatchewan: May 20** (earliest)
- Alberta: May 25
- Manitoba: May 28
- British Columbia: June 4
- Prince Edward Island: June 5
- New Brunswick: June 6
- **Ontario: June 8**
- Nova Scotia: June 9
- Newfoundland & Labrador: June 19
- **Quebec: June 27** (latest)</p>
<p>The gap between Saskatchewan and Quebec is **38 days** — over five weeks. A family living in Quebec works five more weeks of the year for government than a family in Saskatchewan does.</p>
<p>Why? Higher provincial income tax rates and steeper progressive brackets in Quebec (top combined federal-provincial marginal rate above 53%), plus a higher provincial sales tax (QST at 9.975% versus PST at 6-7%), plus higher payroll levies (QPIP, the Health Services Fund, etc.). The Quebec provincial government delivers a broader basket of social programs (subsidized $9/day daycare, lower post-secondary tuition for Quebec residents, broader pharmacare) — but the tax bill side of the ledger is what Tax Freedom Day measures.</p>
<h2>The historical arc — 1961 to 2026</h2>
<p>Tax Freedom Day is not a new measure. The Fraser Institute has calculated it every year since 1961.</p>
<p>The trajectory:</p>
<p>- **1961: May 3.** Average family income $5,000; tax bill $1,675; **33.5%** of income.
- **1981: May 30.** Tax bill had reached $11,429.
- **2000: June 28.** The latest Tax Freedom Day in Canadian history — every dollar earned through almost the end of June went to government. Tax bill: $25,268.
- **2010: June 10.** Two decades of federal GST cuts (7% → 6% → 5%), corporate income tax cuts, and BC, Manitoba, and Saskatchewan personal-tax relief had pulled the date back almost three weeks from the 2000 peak.
- **2024: June 12.**
- **2025: June 8.**
- **2026: June 9.**</p>
<p>The total tax bill of the average Canadian family has grown **2,784 percent** since 1961 — faster than the consumer price index (+925%), faster than housing costs (+2,129%), faster than food (+927%), faster than clothing (+460%). The average family's share of income going to tax has shifted from one-third in 1961 to nearly half (43.5%) in 2026.</p>
<p>Incomes grew too — by about 2,186% over the period — so the inflation-adjusted real tax bill is up roughly 181%, not 2,784%. But the share of income captured by tax has unambiguously risen across that 65-year window.</p>
<h2>The honest "yes but"</h2>
<p>Three legitimate qualifications belong with this analysis.</p>
<p>**Tax Freedom Day measures price, not value.** The $72,539 funds healthcare, public schools, OAS and CPP retirement income, the Canada Child Benefit, the military, the RCMP and provincial police, the courts, roads and bridges, EI when you lose your job, and the social safety net. Whether the value received is worth the price is a question each Canadian gets to answer based on their own use of those services. Tax Freedom Day, by its authors' own description, is "not intended to measure the benefits Canadians receive from governments in return for their taxes." It is a sticker price, not a value judgment.</p>
<p>**The Fraser methodology counts business taxes as borne by households.** Corporate income tax, employer-side CPP and EI, and other taxes levied directly on businesses are assumed to be passed through to households in the form of higher consumer prices and lower wages. This is the standard "tax incidence" assumption in economics — it has solid empirical backing — but it is the reason the Fraser household tax bill ($72,539) is higher than what would appear on any individual tax return summed across a family. A different methodology that counted only direct household taxes would produce a smaller number. Both methodologies are defensible; Fraser's is the standard for this style of analysis.</p>
<p>**The 43.5% number is an average, not a universal.** Income tax is progressive — a family at $80,000 pays a much smaller share than a family at $250,000. Sales tax is somewhat regressive — it hits low-income households harder as a share of their income because they spend a higher share of income on taxable goods. Property tax depends entirely on where you live and what you own. The "average family" is a statistical construct; no individual family is precisely the average. Personal Tax Freedom Day varies sharply by income, province, household composition, and life stage.</p>
<p>None of those qualifiers changes the headline number. The average Canadian family is calculated to pay 43.5% of its income in tax in 2026. June 9 is the day the average family is calculated to finish paying it.</p>
<h2>The bottom line</h2>
<p>On the published Fraser Institute calculation, in 2026:</p>
<p>- The average Canadian family will earn **$166,790**.
- It will pay **$72,539** in total taxes — federal + provincial + local + business taxes passed through.
- That is **43.5%** of its income.
- It works the first **159 days of the year** for government.
- **June 9** is the first day it starts keeping what it earns.</p>
<p>The gap between provinces is over five weeks. The trend over 65 years is from one-third of income going to tax (1961) to nearly half (2026). The single largest line is income tax ($25,352), followed by payroll & health ($17,069), sales tax ($10,519), and corporate tax embedded in prices ($7,819).</p>
<p>Whether 43.5% is the right price for the basket of government services Canadians receive is a question worth asking — and it belongs in front of voters and Parliament, not in front of an accounting firm. Parliament Audit publishes the breakdown. The judgment is yours.</p>
<hr />
<p><small>
Originally published by <a href="https://parliamentaudit.ca/news/tax-freedom-day-2026-full-category-breakdown">Parliament Audit</a>
under the <a href="https://creativecommons.org/licenses/by-nd/4.0/">CC BY-ND 4.0</a> license.
<img src="https://parliamentaudit.ca/api/republish-beacon?slug=tax-freedom-day-2026-full-category-breakdown" alt="" width="1" height="1" />
</small></p>
</article>